jHiccup is an open source tool designed to measure the pauses and stalls (or “hiccups”) associated with an application’s underlying Java runtime platform. The new tool captures the aggregate effects of the Java Virtual Machine (JVM), operating system, hypervisor (if used) and hardware on application stalls and response time. You can read Azul CTO Gil Tene’s blog post “How Java Got the Hiccups” here.
With jHiccup, you can generate charts like this:
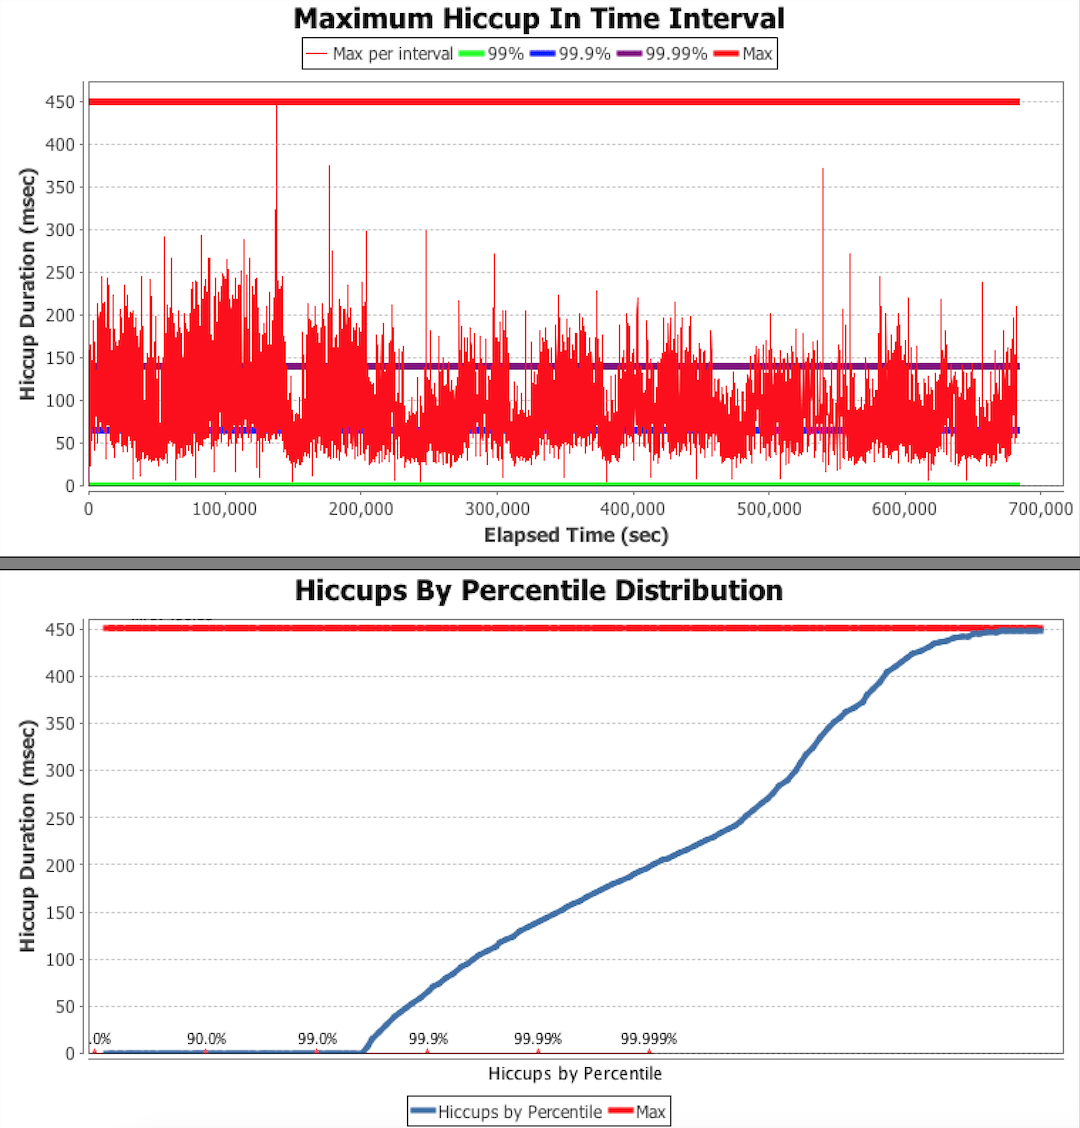
jHiccup allows developers, systems operators and performance engineers to easily create and analyze response time profiles, and to clearly identify whether causes of application delays reside in the application code or in the underlying runtime platform. jHiccup is completely transparent and non-intrusive to the application, has zero performance overhead in operation, and is compatible with all Java applications using any JVM.
The hiccups measured are NOT stalls caused by the application’s code. They are stalls caused by the platform that would be visible to and affect any application thread running on the platform at the time of the stall. jHiccup shows graphically via ‘Hiccup Charts’ just how responsive the runtime platform really is. By understanding the pauses associated with the underlying platform, IT organizations can better isolate latency and delays and the contributing components.
Here are some Hiccup Charts from a recent series of Cassandra benchmarks:
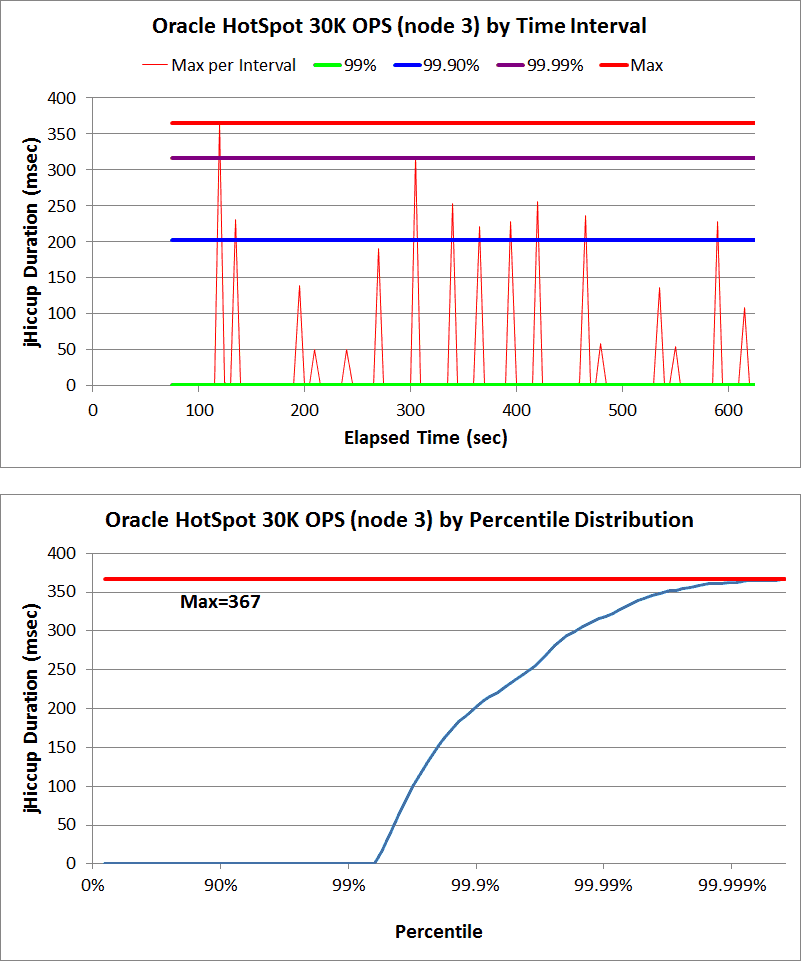
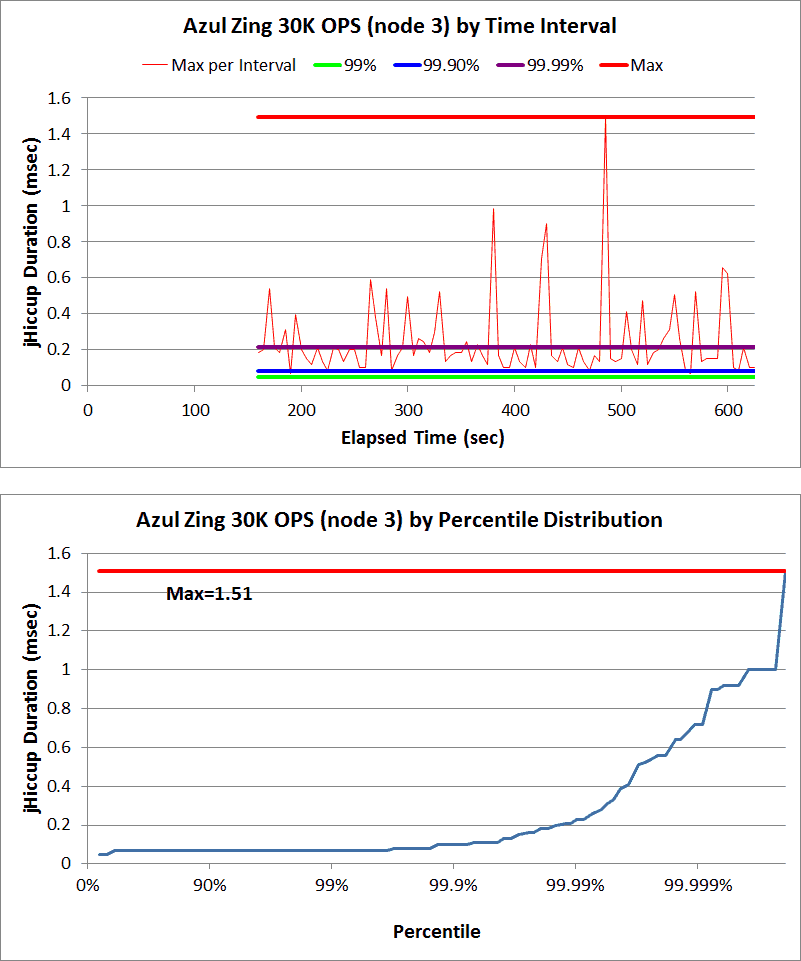
Note: you can read the entire benchmark summary here.
If jHiccup experiences and records a certain level of measured platform hiccups, it is safe to assume that the application running on the same JVM platform during that time had experienced hiccup/stall effects that are at least as large as the measured level.
jHiccup helps you avoid common pitfalls in application performance characterization. Most performance reporting assumes a normal distribution of response times (single mode), yet most ‘real’ systems are multi-modal due to GC pauses, OS or virtualization ‘hiccups’, swapping, etc. jHiccup can help you find and identify the causes of these delays that affect response times.
jHiccup works with any Java application. It is non-intrusive, runs on all major operating systems and is compatible with all JVMs.
To use jHiccup, include the script command in your Java application start command. For example, if your program were normally executed as: java UsefulProgram -a -b -c, The launch line would become:jHiccup java UsefulProgram -a -b -c.
jHiccup is run as a wrapper around other applications so that measurements can be done without any changes to application code.
Do I have to use Excel to chart my output?
While the initial version of jHiccup ships with sample Excel spreadsheets (verified for both PC and Mac) you can import and process jHiccup log data with any analysis tool.
jHiccup was written by Azul Systems and released to the public domain as explained at http://creativecommons.org/publicdomain/zero/1.0/.
Click here to download the jHiccup bits.
You can get more information from the documentation included with the download, or by sending a note to [email protected].
The Azul Platform can turbocharge your Java apps, improving their performance while reducing your costs. We’re ready to help.